EUROSUR Fusion Services (EFS) Service Desk
EUROSUR Fusion Services (EFS) Service Desk
Email
efs@frontex.europa.eu
EUROSUR Fusion Services (EFS) Service Desk
This service provides information about past, current and forecasted weather conditions, lighting strikes, weather radar images (from national weather services) and radar forecast up to 2 hours.
The following data is presented via dedicated graphical information layers and accessible directly in the Frontex systems available to all users:
a. Atmospheric - Observations for locations:
1. In-situ, past data from weather stations.
2. Weather forecast (7 days) for locations:
The following table presents the available meteorological parameters for locations:
|
Data attribute |
Unit |
Sample value |
Parameter description |
|
Time |
UTC |
2019-11-25T13:00:00Z |
Date and time |
|
Name |
text |
S. Maria Di Leuca |
Station name |
|
ICAO |
text |
LIBY |
ICAO (International Civil Aviation Organization) code of airport weather stations |
|
Height |
m |
104 |
Height of the location of a station |
|
Weather |
text |
Fair |
General status of current weather |
|
Air_temp |
oC |
13.8 |
Air temperature at 2 m |
|
Dewpoint |
oC |
12.3 |
Temperature to which the air would have to cool in order to reach saturation |
|
Humidity |
% |
91 |
Relative humidity |
|
Wind_dir |
degrees |
108 |
Wind direction |
|
Wind_speed |
kts |
6 |
Average wind speed over 10 minutes at a height of 10 metres |
|
Wind_gust |
kts |
12 |
Highest 3 seconds duration wind speed at 10 metres |
|
CloudCover |
octas |
8 |
The fraction of the sky obscured by clouds |
|
Pressure |
hPa |
1002.6 |
Atmospheric pressure at sea level |
|
Visibility |
Km |
9.1 |
Horizontal visibility |
|
Precip_1hr |
Mm |
0.3 |
Precipitation amount past 1 hour |
|
Precip_6hr |
Mm |
1.5 |
Precipitation amount past 6 hours |
|
Precip% |
% |
12 |
Precipitation probability past 6 hours > 0.2 mm |
|
Snow_depth |
M |
0 |
The depth of the accumulated snow |
|
Snow_1hr |
mm |
0 |
Amount of fresh snowfall past hour |
|
Snow_6hr |
mm |
0 |
Amount of fresh snowfall past 6 hours |
|
FZL |
M |
2323 |
Freezing level |
|
Thunder% |
% |
4 |
Thunder probability |
b. Atmospheric, area-covering model data and forecast:
Current, forecasted and past (7 days) atmospheric conditions based on European Centre for Medium-Range Weather Forecasts (ECMWF) weather models provided for the geographical extent described in section VI.
The ECMWF runs a sophisticated set of mathematical models of the global atmosphere which assimilates observations from ground weather stations, ships, radiosondes, satellites, weather radar, airplanes etc. into analysis of the current state of the atmosphere. Using the resulting analysis as a starting condition the centre calculates twice daily (initialized with the analysis of 00 UTC and 12 UTC) a forecast for up to 7 days ahead.
|
Data attribute |
Unit |
Description |
Display |
|
Air temperature 2m |
oC |
Temperature of the air a 2 meters above surface level |
area and contours |
|
Apparent temperature |
oC |
Perceived outdoor temperature,caused by the combined effects of air temperature, relative humidity and wind speed. |
area and contours |
|
Dew point 2m |
oC |
Temperature to which the air would have to cool (at constant pressure and constant water vapour content) in order to reach saturation. |
area and contours |
|
Ground temperature |
oC |
Temperature of the ground. |
area and contours |
|
Precipitation amount 3/6 -hourly |
mm |
The amount of precipitation over a period of 3/6 hours prior to the chosen time stamp. |
area and contours |
|
Precipitation probability |
% |
The chance that there will be precipitation at that time. |
area and contours |
|
Pressure mean sea level |
hPa |
The atmospheric pressure (the weight of the atmosphere) at sea level at a given location. |
area and contours |
|
Snow depth |
m |
The depth of the accumulated snow. |
area and contours |
|
Snowfall 3/6 -hourly |
mm |
The amount of fresh snow over a period of 3/6 hours prior to the chosen time stamp. |
area and contours |
|
Total cloud cover |
% |
The fraction of the sky obscured by clouds when observed from a particular location. |
area and contours |
|
Visibility |
km |
The horizontal visibility. |
area and contours + grid |
|
Wind chill |
oC |
The perceived outdoor temperature, caused by the combined effects of air temperature and wind speed. |
area and contours |
c. Weather - Observations and Short Range Forecast
Additional weather phenomena visually presented as follows:
|
Data attribute |
Description |
Visualisation |
|
Lightings |
Lightning strikes observed over the past 60 minutes. The attributes provide information on the type (Cloud to ground or Cloud to cloud) and the amplitude of a strike (strength). Observations available up to 3 days back with interval steps every 15 minutes (every update contains data over a period of 60 minutes). |
Overlay |
|
Precipitation and precipitation type |
Ground weather radar reflectivity observations combined with other information to provide images showing precipitation type (rain, freezing rain, hail, sleet, snow) and its intensity. Short range forecast (2 hours) based on model also available. |
Overlay |
|
Cloud forecast |
Model based cloud forecast |
Overlay |
|
Cloud cover satellite images: visible and infrared (IR) |
Visible images represent the amount of sunlight being scattered back into space by the clouds, aerosols, atmospheric gases, and the earth's surface. Thicker clouds have a higher reflectivity (or albedo) and appear brighter than thinner clouds on a visible image. |
Overlay |
|
Infrared satellite images are the measurements that are related to brightness temperature. Since temperature usually decreases with height, high level clouds are colder than low level clouds. Therefore, high level clouds appear brighter than low level clouds. |
Overlay |
d. Historical data
The online services described in point a) and b) provide data for a historic period of time up to 7 days. The weather radar and meteorological satellite services described in point c) provide data for a historic period of time up to 4 days (lightings - 3 days).
Additionally, atmospheric model and forecast data (mentioned in part b) can be requested for a historic period of time since January 2017. The data is available as polygon (area) and point (grid) GIS feature classes.
EBCG Regulation (EU) 2019/1896
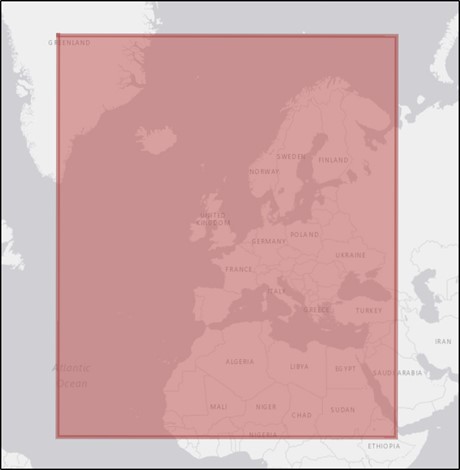
The data is used for operational and mission planning as well as risk analysis purposes. It covers the entire Schengen Area and the adjacent third countries and open seas, as in the figure below:
The data is supplied by a commercial operator ingesting data from a variety of commercial and national in-situ sources. Satellite images come from Meteosat, GOES and MTSAT for visualisation purposes.
The data is supplied via Open GIS Consortium (OGC) web services by the service provider and ingested into Frontex systems. From there it is provided to authorised users. The past model data (from the previous day) is supplied as GIS datasets and loaded into the Frontex database.
Access to online meteorological data is granted to EFS users.
The archive, model-based meteorological data can be delivered upon request to EFS Service Desk.